How to use PrimeScope
Kako se koristi PrimeScope
PrimeScope is a practice account with virtual money and real market prices, plus chart analysis tools. This guide walks through the terminal, placing orders, adding indicators and saving them as templates and layouts.
PrimeScope je vežbovni nalog sa virtuelnim novcem i pravim tržišnim cenama, uz alate za analizu grafikona. Uputstvo prolazi kroz terminal, otvaranje naloga, dodavanje indikatora i njihovo čuvanje kao šablona i rasporeda.
1LabelOznaka On every screenshot a yellow label with an arrow points to a part of the screen. The number matches the order in which it is explained. Na svakom snimku žuta oznaka sa strelicom pokazuje deo ekrana. Broj prati redosled objašnjenja.
- Getting startedPrvi koraci
- Main toolbarGlavna traka
- Market Watch
- The chartGrafikon
- Orders and positionsNalozi i pozicije
- Drawing toolsAlati za crtanje
- Adding indicatorsDodavanje indikatora
- Indicator templatesŠabloni indikatora
- LayoutsRasporedi (Layouts)
- Depth of Market (DOM)Dubina tržišta (DOM)
- Keyboard shortcutsPrečice na tastaturi
Getting startedPrvi koraci
- Start the 7-day free trial or buy a subscription on primescope.app. The account number and password arrive by email.
- Log in at primescope.app/login with the account number and password. The same account works in the Windows and macOS app.
- The terminal opens with a practice balance of virtual money. Profit and loss are calculated from real prices, but no real money is ever at risk.
- Pokreni probni period od 7 dana ili kupi pretplatu na primescope.app. Broj naloga i lozinka stižu mejlom.
- Prijavi se na primescope.app/login brojem naloga i lozinkom. Isti nalog radi i u aplikaciji za Windows i macOS.
- Terminal se otvara sa vežbovnim saldom u virtuelnom novcu. Dobit i gubitak se računaju po pravim cenama, ali pravi novac nikad nije u igri.
The terminal at a glance
Terminal na prvi pogled
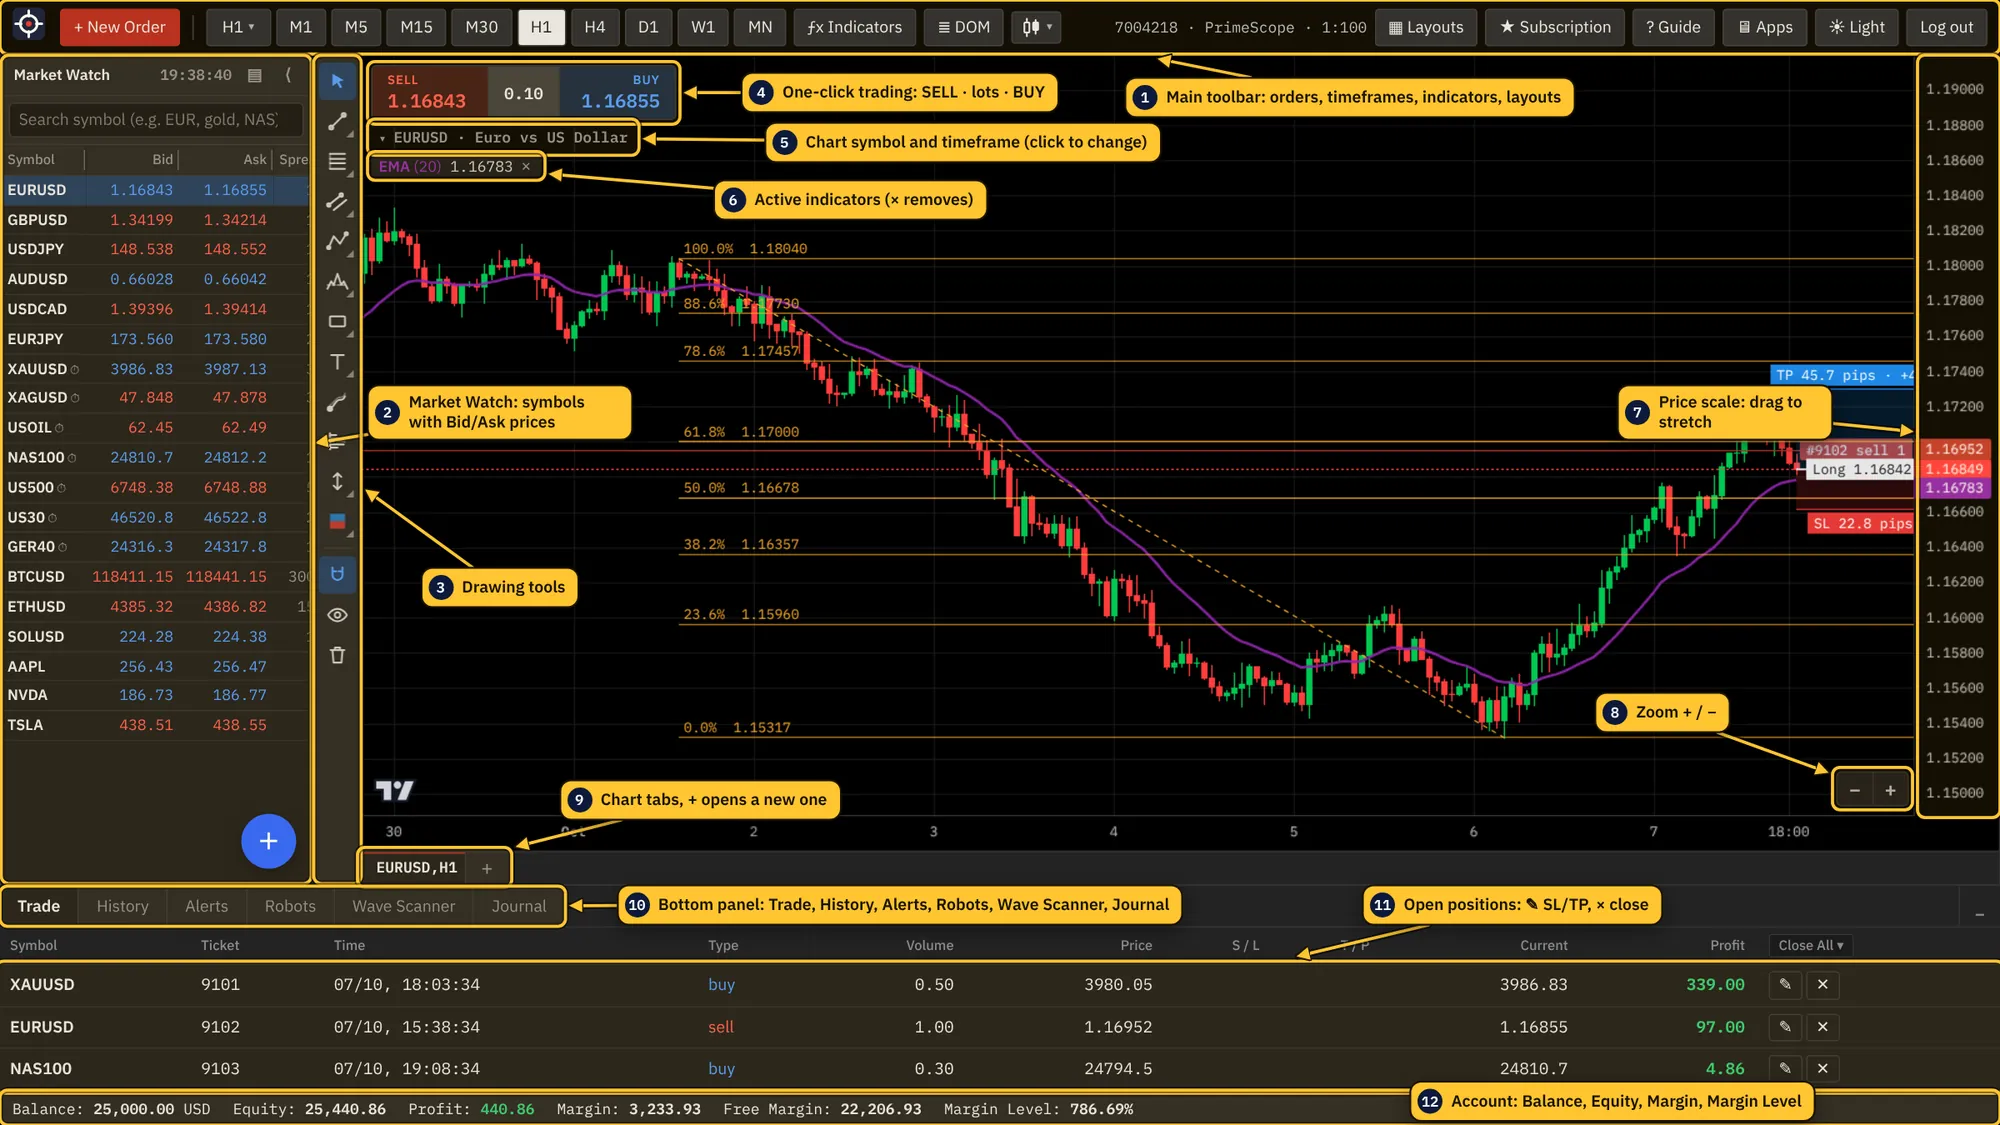
- Balance is the account money without open positions; Equity adds their current profit or loss.
- Margin is the amount held for open positions (position value ÷ leverage). Margin Level = Equity ÷ Margin. Below 50% the platform closes the position with the largest loss first (stop out).
- Market Watch, panel sizes, the chart, indicators and drawings are remembered in the browser. Save them as a layout to keep them on every device.
- Balance je novac na nalogu bez otvorenih pozicija; Equity dodaje njihov trenutni profit ili gubitak.
- Margin je iznos zauzet otvorenim pozicijama (vrednost pozicije ÷ poluga). Margin Level = Equity ÷ Margin. Ispod 50% platforma prvo zatvara poziciju sa najvećim gubitkom (stop out).
- Market Watch, veličine panela, grafikon, indikatori i crteži se pamte u browseru. Sačuvaj ih kao raspored da bi bili isti na svakom uređaju.
Main toolbarGlavna traka

- + New Order opens the order window (also F9).
- Timeframes: M1, M5, M15, M30, H1, H4, D1, W1, MN. The ▾ button lists all of them.
- ƒx Indicators opens the list of indicators and the templates (chapters 7 and 8).
- ≣ DOM opens the Depth of Market for crypto (chapter 10). The next button switches the chart type.
- ▦ Layouts saves and loads the whole workspace (chapter 9). ★ Subscription shows your plan, ? Guide opens this guide, Apps the desktop downloads, and the theme button switches light and dark.
- + New Order otvara prozor za nalog (i taster F9).
- Periodi: M1, M5, M15, M30, H1, H4, D1, W1, MN. Dugme ▾ prikazuje sve.
- ƒx Indicators otvara spisak indikatora i šablone (poglavlja 7 i 8).
- ≣ DOM otvara dubinu tržišta za kripto (poglavlje 10). Sledeće dugme menja tip grafikona.
- ▦ Layouts čuva i učitava ceo radni prostor (poglavlje 9). ★ Subscription prikazuje pretplatu, ? Guide otvara ovo uputstvo, Apps desktop aplikacije, a dugme za temu menja svetlu i tamnu.
Market Watch
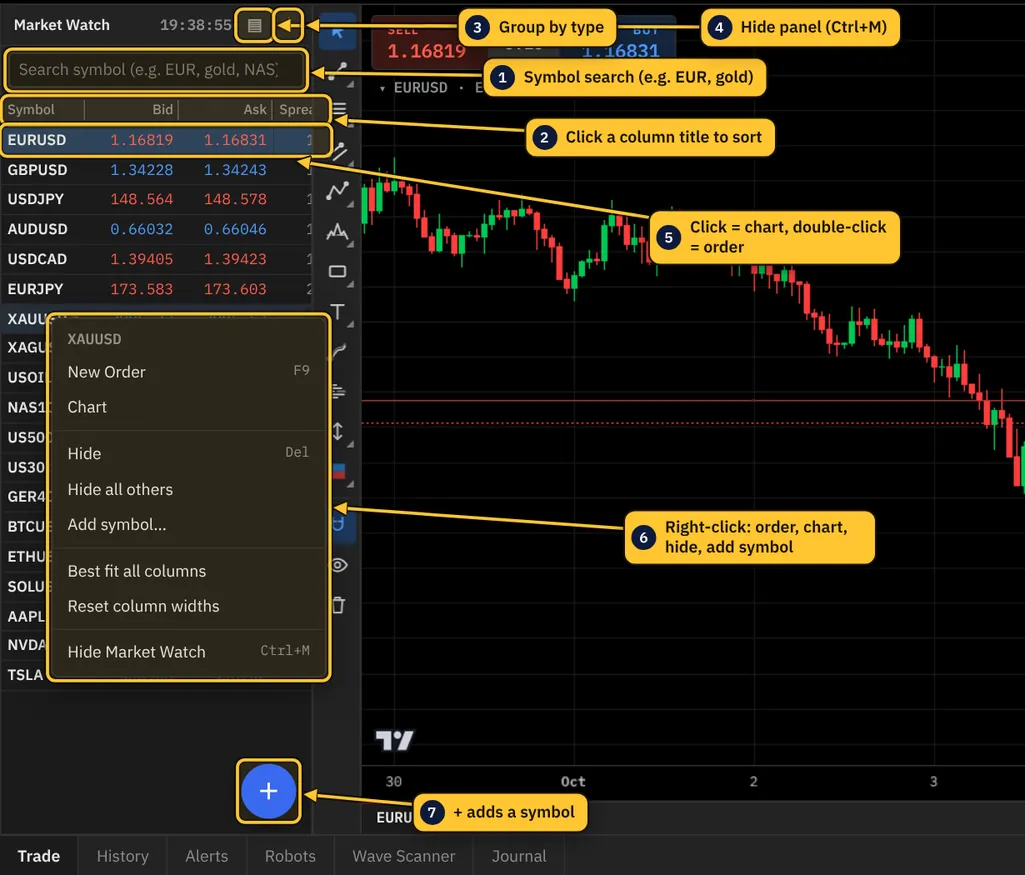
The list of instruments you follow, with live Bid and Ask prices. A clock icon marks a delayed price; a greyed row means the market is closed.
Lista instrumenata koje pratiš, sa Bid i Ask cenama uživo. Ikonica sata označava cenu sa zakašnjenjem; posivljen red znači da je tržište zatvoreno.
- Click a symbol to show it on the chart, double-click to open an order.
- Right-click for the menu: New Order, Chart, Hide, Hide all others, Add symbol.
- + (bottom right) adds a symbol: type part of the name (GBP, oil, Apple, DAX) and click it.
- Click a column title to sort; drag the edge of a title to resize the column.
- Ctrl+M or ⟨ hides the whole panel to make the chart wider.
- Klik na simbol ga prikazuje na grafikonu, dupli klik otvara nalog.
- Desni klik otvara meni: New Order, Chart, Hide, Hide all others, Add symbol.
- + (dole desno) dodaje instrument: ukucaj deo imena (GBP, oil, Apple, DAX) i klikni na njega.
- Klik na naslov kolone sortira; prevlačenje ivice naslova menja širinu kolone.
- Ctrl+M ili ⟨ sakriva ceo panel, pa je grafikon širi.
The chartGrafikon
- Scroll with the mouse wheel or drag the chart; + and − zoom. Drag the price scale up or down to stretch the chart vertically.
- Click the symbol title above the chart to switch to another instrument.
- Chart tabs under the chart: + opens another chart, Ctrl+F6 moves to the next tab, a middle click closes a tab.
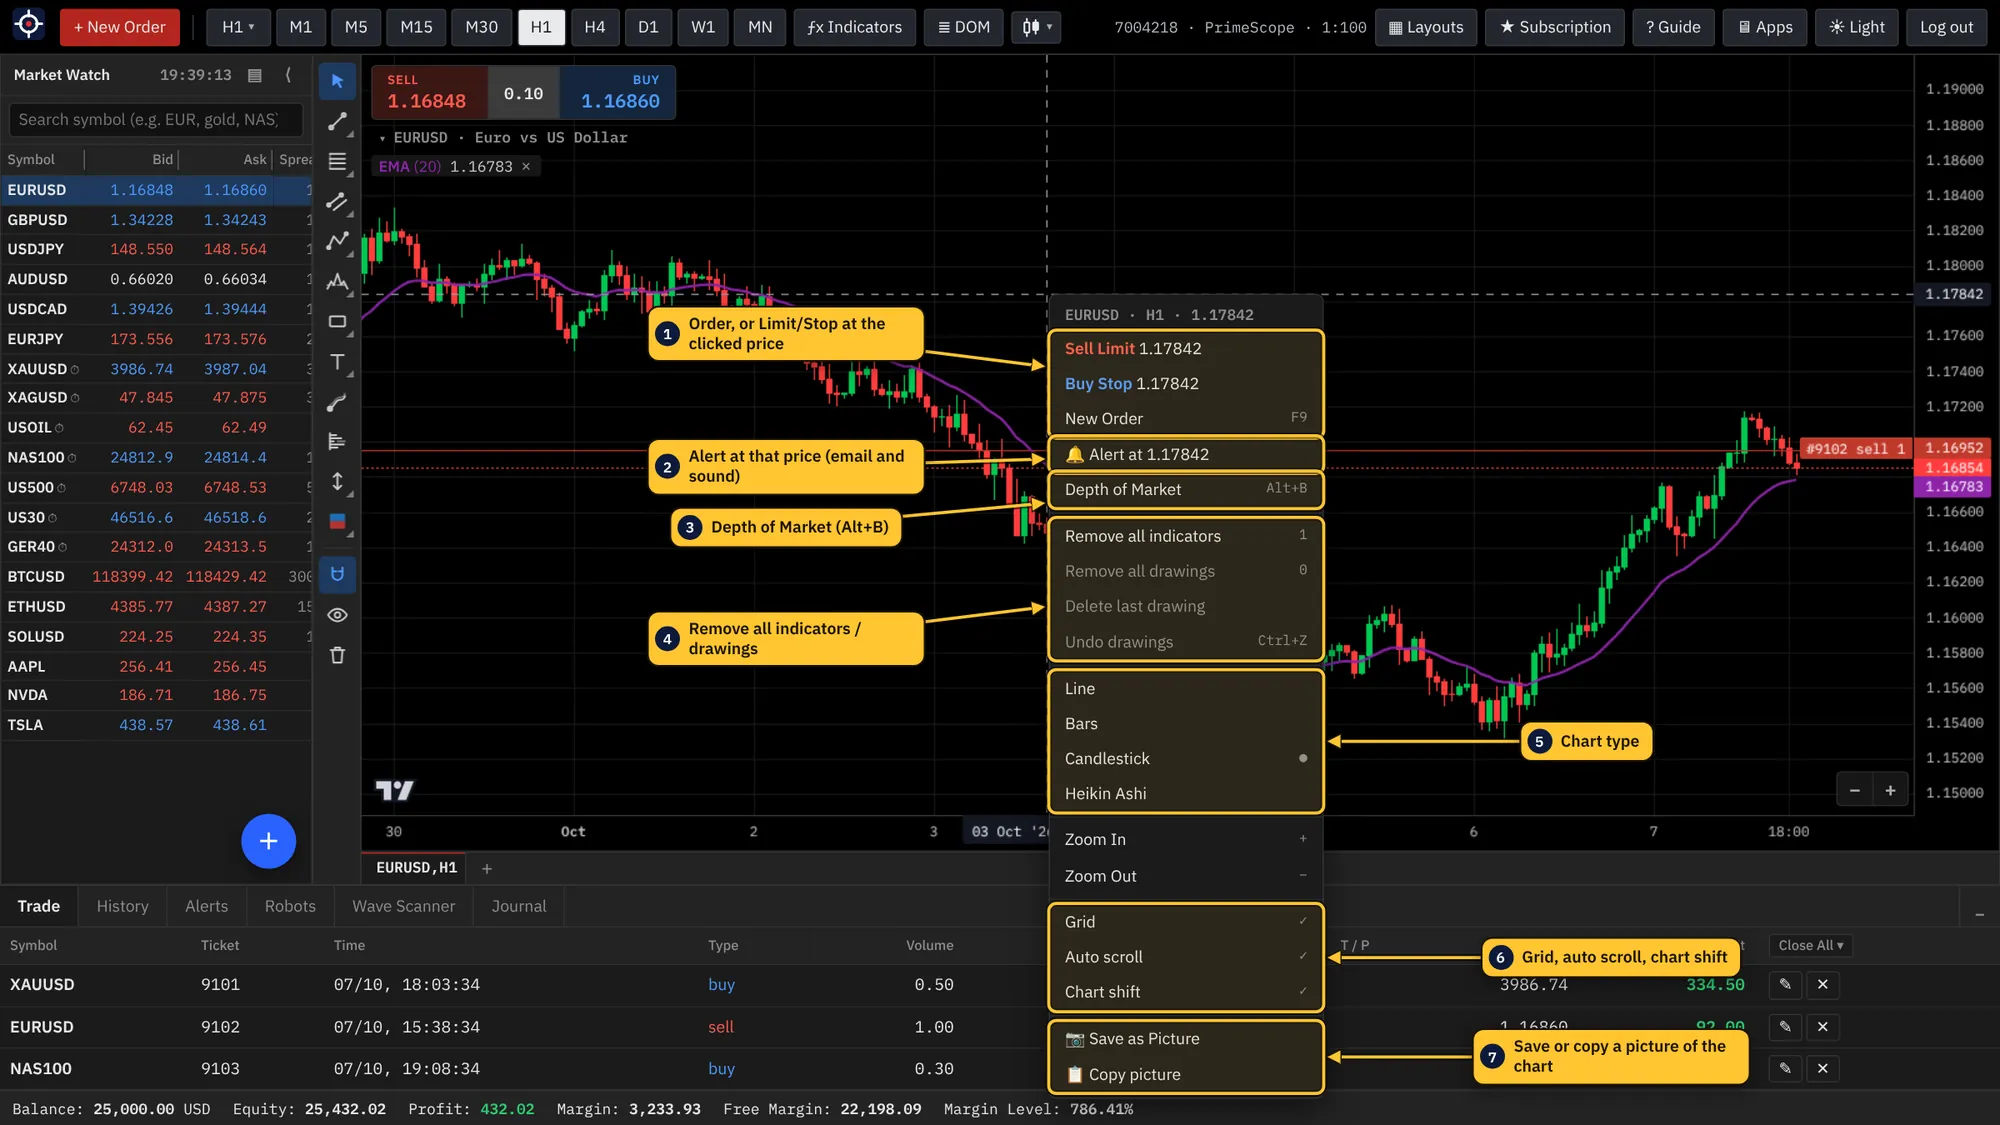
- Right-click (or double-click) the chart for the menu below. At the clicked price it offers a Limit or Stop order and a price alert.
- Pomeranje točkićem miša ili prevlačenjem grafikona; + i − zumiraju. Prevlačenje cenovne skale gore-dole razvlači grafikon po visini.
- Klik na naziv simbola iznad grafikona menja instrument.
- Kartice grafikona ispod grafikona: + otvara još jedan grafikon, Ctrl+F6 prelazi na sledeću karticu, srednji klik zatvara karticu.
- Desni klik (ili dupli klik) na grafikon otvara meni sa slike. Na ceni gde je kliknuto nudi Limit ili Stop nalog i alarm.
Orders and positionsNalozi i pozicije
Opening a position
Otvaranje pozicije
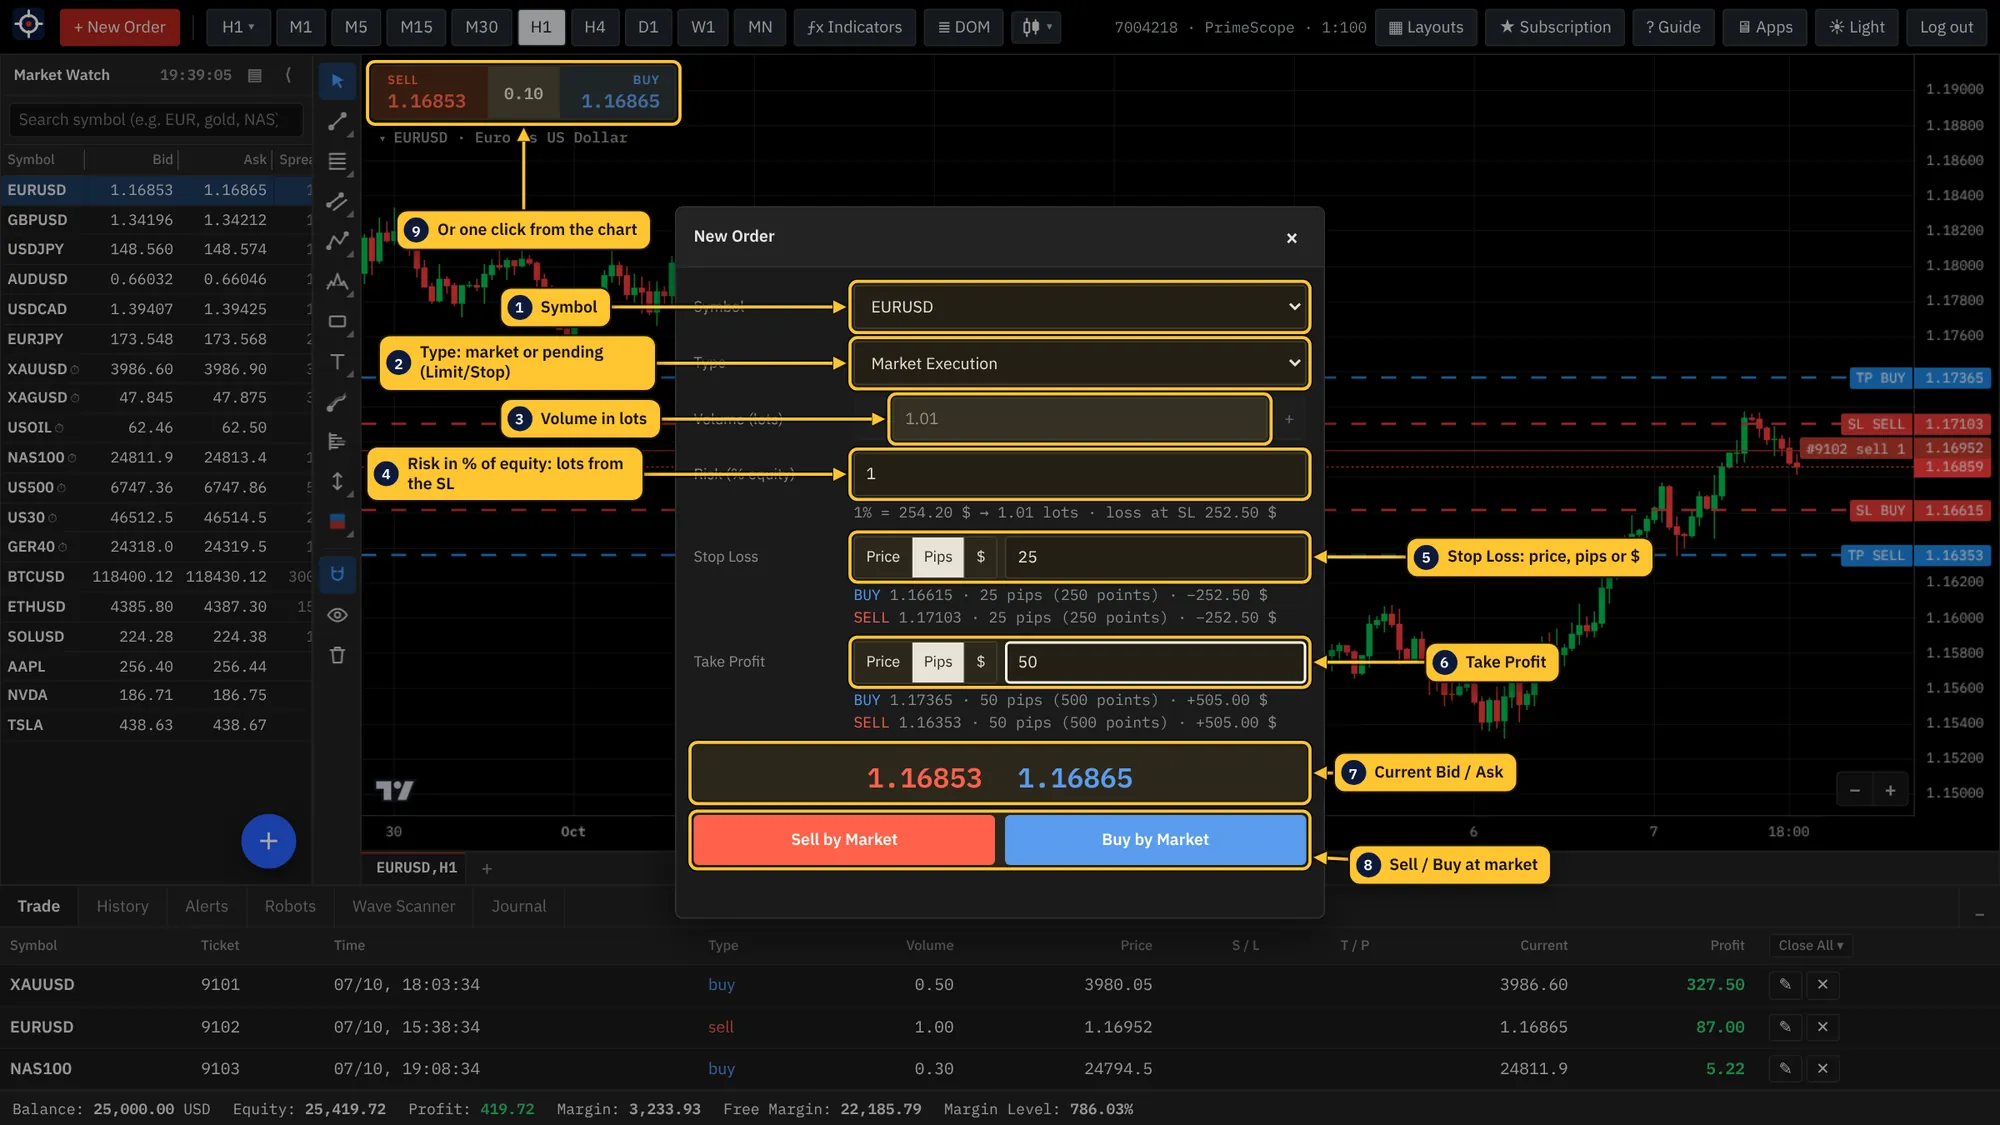
- Press + New Order or F9 and choose the symbol.
- Type: Market Execution opens at the current price. Buy/Sell Limit and Buy/Sell Stop wait for the order price you enter.
- Enter the volume in lots, or a risk in % of equity: with a Stop Loss set, the platform calculates the lots for you.
- Set Stop Loss and Take Profit as a price, in pips or in $. The lines appear on the chart, and the hint shows the loss or profit at each level.
- Press Sell by Market or Buy by Market. Buy fills at Ask, Sell at Bid.
- Pritisni + New Order ili F9 i izaberi instrument.
- Type: Market Execution otvara po trenutnoj ceni. Buy/Sell Limit i Buy/Sell Stop čekaju cenu naloga koju upišeš.
- Upiši količinu u lotovima ili rizik u % kapitala: uz postavljen Stop Loss platforma sama računa lotove.
- Postavi Stop Loss i Take Profit kao cenu, u pipsima ili u $. Linije se vide na grafikonu, a ispod polja piše gubitak ili dobit na tom nivou.
- Pritisni Sell by Market ili Buy by Market. Buy se izvršava po Ask, Sell po Bid ceni.
One-click trading: the SELL and BUY buttons in the top-left corner of the chart open a position immediately with the lots typed between them.
Trgovanje jednim klikom: dugmad SELL i BUY u gornjem levom uglu grafikona odmah otvaraju poziciju sa lotovima upisanim između njih.
Managing positions
Upravljanje pozicijama
- ✎ in the position row changes Stop Loss and Take Profit; clicking a position or SL/TP line on the chart opens the same window.
- ✕ closes the position. Close All ▾ closes all, only profitable or only losing positions.
- Closed trades are in History, platform messages in Journal.
- ✎ u redu pozicije menja Stop Loss i Take Profit; isti prozor otvara i klik na liniju pozicije ili SL/TP na grafikonu.
- ✕ zatvara poziciju. Close All ▾ zatvara sve, samo profitabilne ili samo gubitničke pozicije.
- Zatvoreni nalozi su u History, poruke platforme u Journal.
Drawing toolsAlati za crtanje
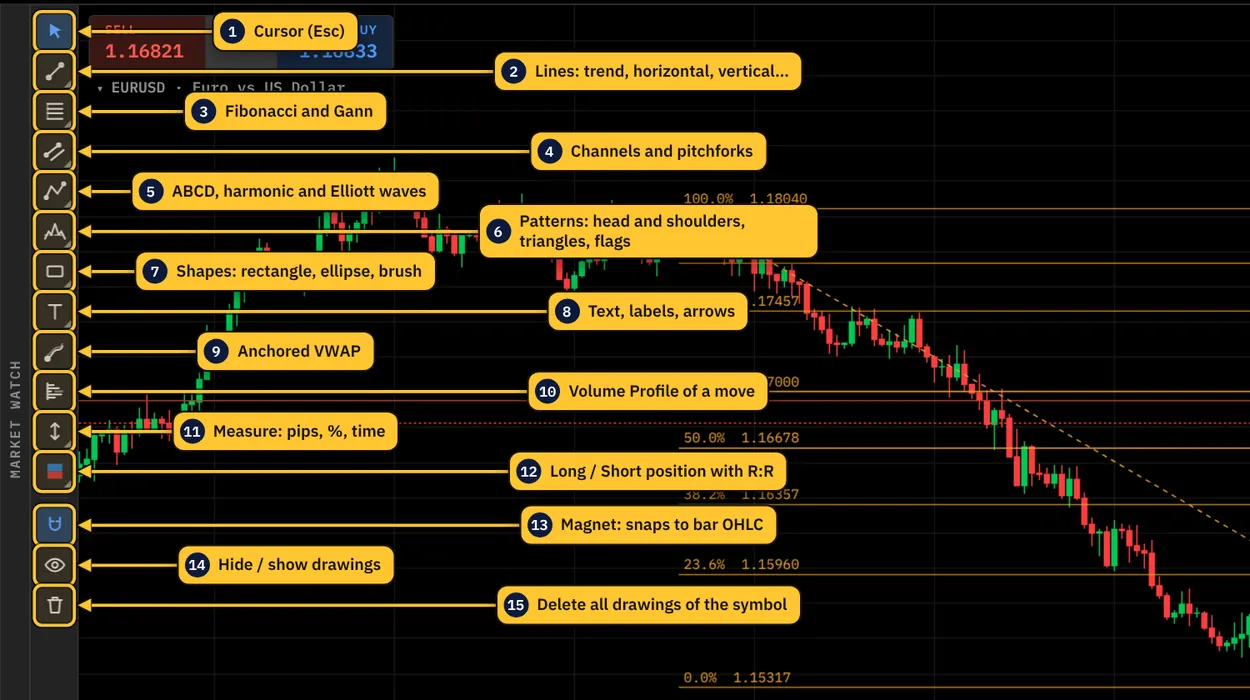
- Each button is a group. A small triangle in its corner means more tools: hold the button, right-click it or click the triangle to choose another one (for example horizontal line, Fibonacci extension, Elliott correction).
- Click a tool, then click the points on the chart. A hint at the bottom of the chart tells you which point comes next.
- Click a drawing to select it: drag its points to move them, and a small bar appears with color, line width and delete. Delete also removes it, Ctrl+Z undoes. A selected horizontal line has 🔔 Alert for a price alert.
- Magnet snaps points to the open, high, low or close of a bar. Hold Ctrl while drawing to switch it for one move.
- Long / Short Position draws entry, SL and TP with R:R; select it and press ▶ Place order to open the order window with those levels.
- Drawings are saved per symbol and stay on every timeframe.
- Svako dugme je grupa. Mali trougao u uglu znači da ima još alata: drži dugme pritisnuto, klikni desnim tasterom ili na trougao i izaberi drugi (npr. horizontalna linija, Fibonacci ekstenzija, Elliott korekcija).
- Klikni na alat, pa na tačke na grafikonu. Na dnu grafikona piše koja je sledeća tačka.
- Klik na crtež ga bira: tačke se prevlače, a pojavi se mala traka sa bojom, debljinom linije i brisanjem. Delete ga takođe briše, Ctrl+Z vraća. Izabrana horizontalna linija ima 🔔 Alert za alarm na ceni.
- Magnet lepi tačke za open, high, low ili close sveće. Drži Ctrl dok crtaš da ga privremeno uključiš ili isključiš.
- Long / Short Position crta ulaz, SL i TP sa R:R; izaberi ga i pritisni ▶ Place order da se otvori nalog sa tim nivoima.
- Crteži se čuvaju po simbolu i vide se na svim periodima.
Adding indicatorsDodavanje indikatora
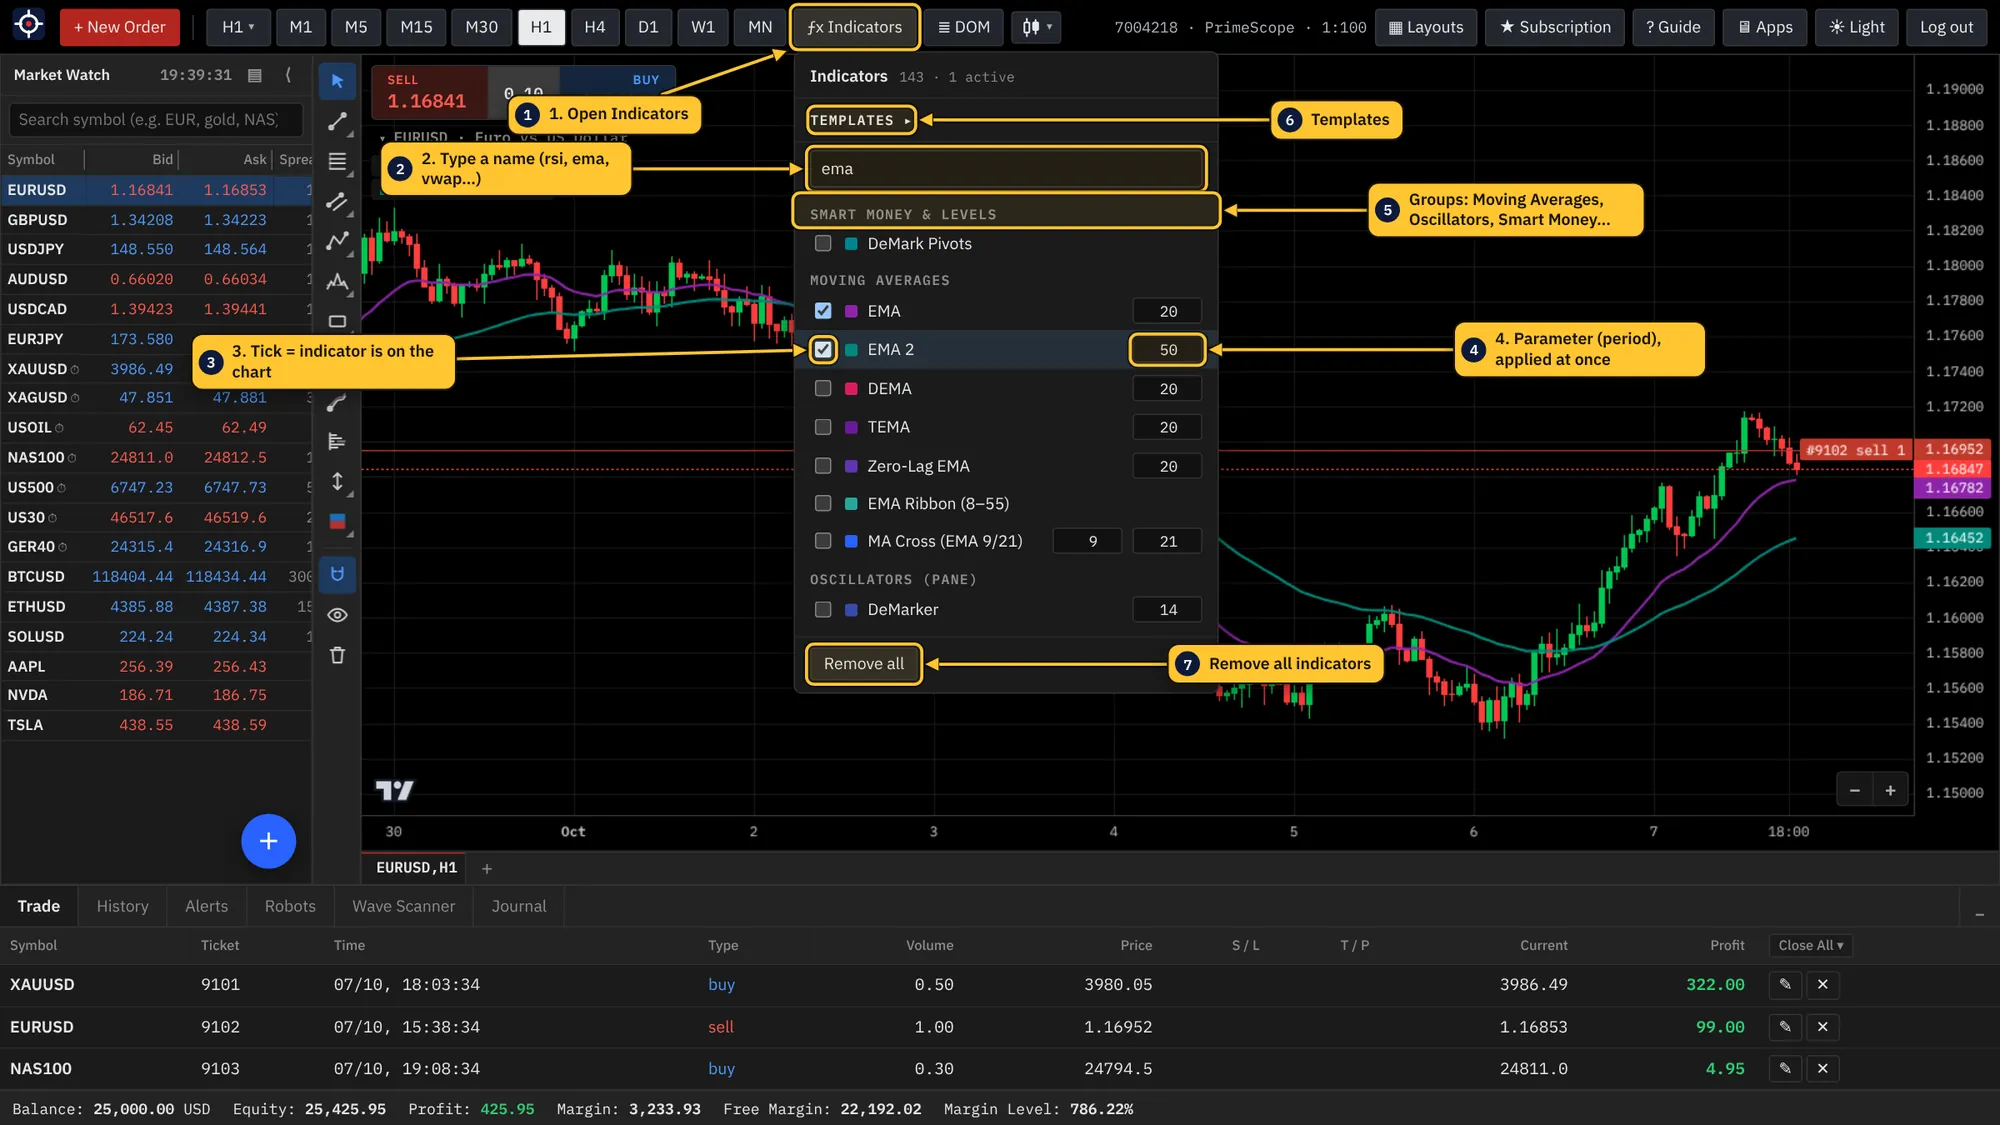
- Click ƒx Indicators in the toolbar.
- Type part of the name in the search field:
rsi,ema,vwap,order… The list keeps only the matches. - Tick the checkbox next to the indicator. It appears on the chart at once.
- Change the parameters in the fields to the right (hover a field to see its name, for example Period). The chart redraws immediately; there is no Save button.
- Close the list with Esc or a click outside it.
- Klikni ƒx Indicators na glavnoj traci.
- Ukucaj deo imena u polje za pretragu:
rsi,ema,vwap,order… Lista zadržava samo pogotke. - Štikliraj kućicu pored indikatora. Odmah se pojavljuje na grafikonu.
- Promeni parametre u poljima desno (pređi mišem preko polja da vidiš šta je, npr. Period). Grafikon se odmah ponovo iscrtava; dugme za čuvanje ne postoji.
- Zatvori listu sa Esc ili klikom pored nje.
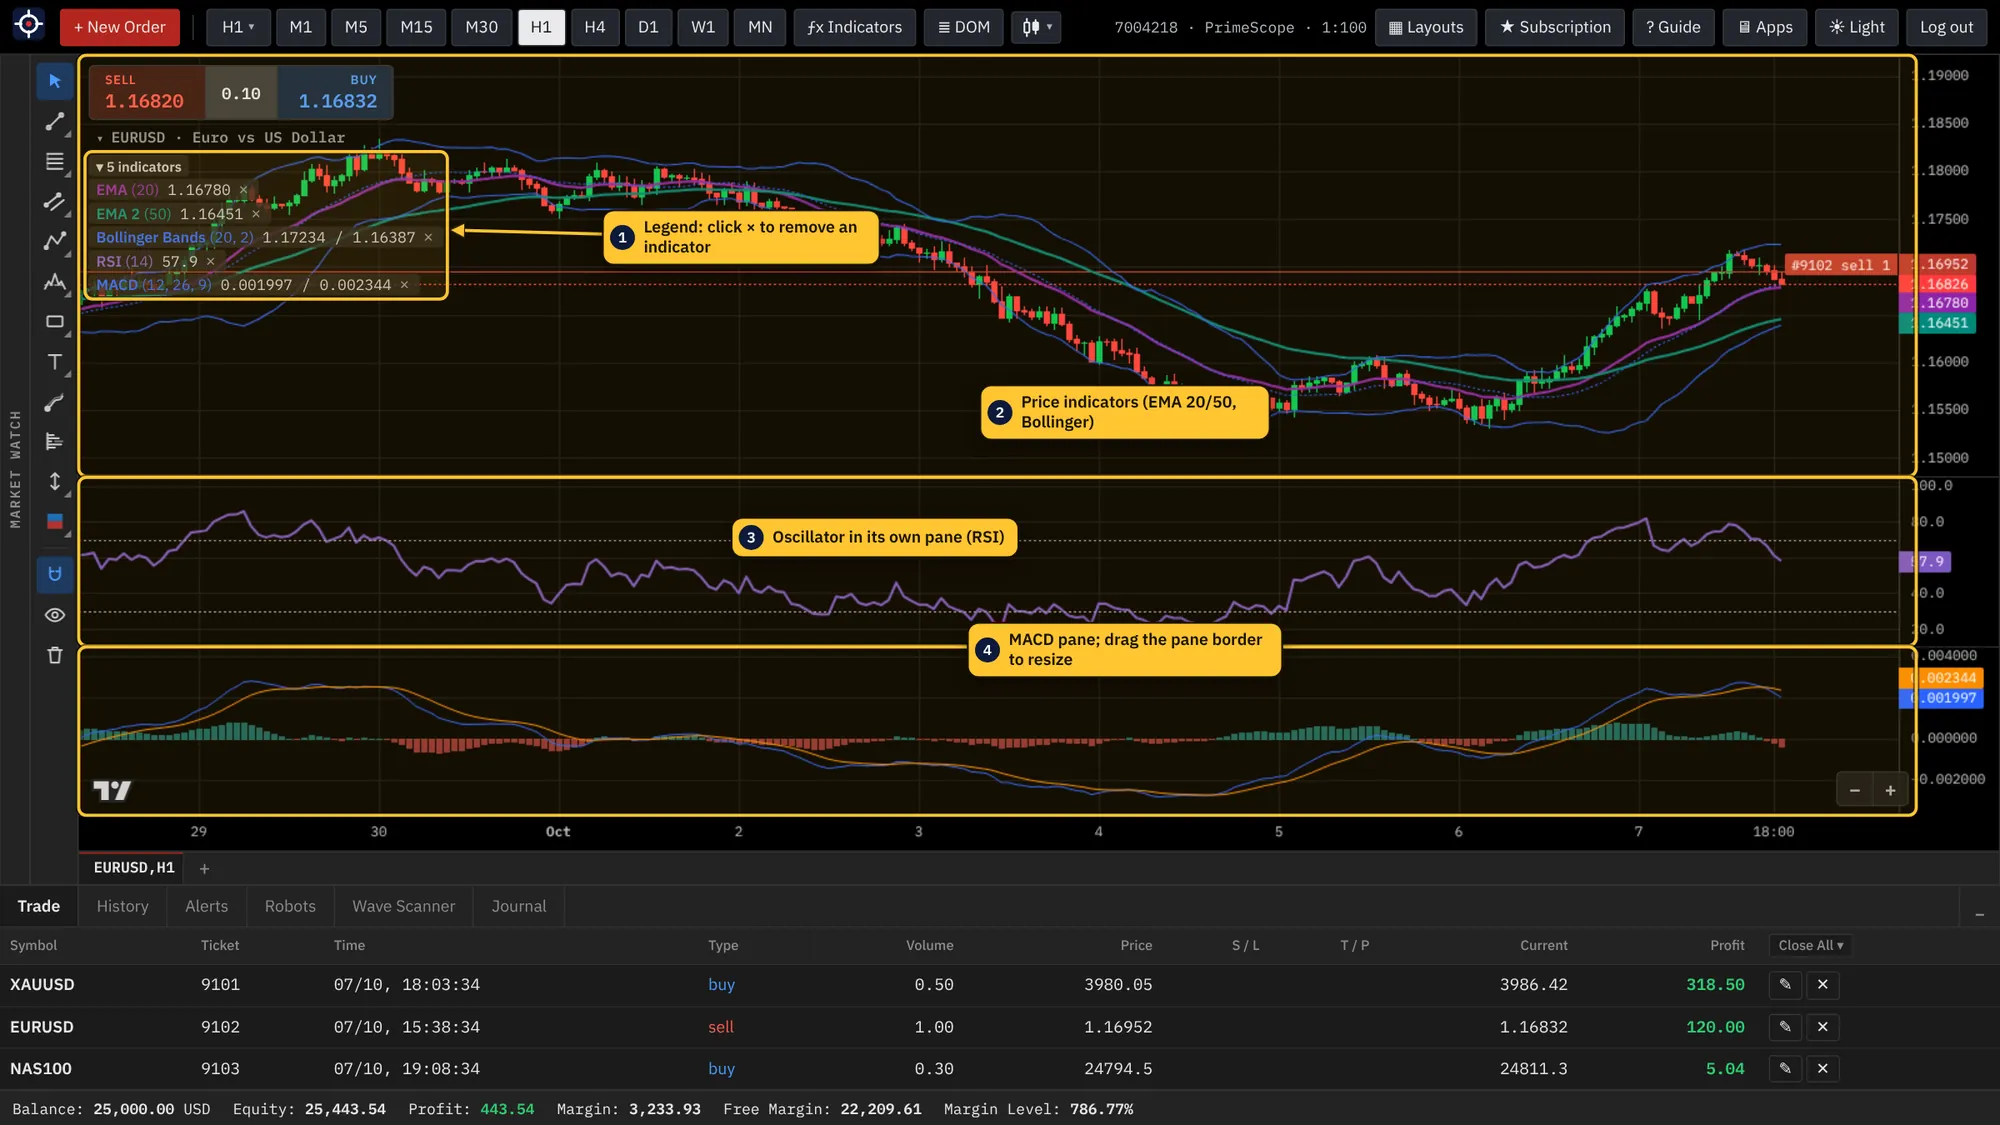
- Remove one indicator: click × next to its name in the legend at the top left of the chart, or untick it in the list.
- Remove all: the button at the bottom of the list, or Remove all indicators in the chart's right-click menu.
- Some indicators exist twice (EMA and EMA 2, SMA and SMA 2) so you can show two periods at once, for example EMA 20 and EMA 50.
- Premium tools (Market Structure, Order Blocks, Liquidity, Divergences, Chart Patterns, Elliott Waves, Order Flow) are calculated on the server and need an active subscription or trial.
- Uklanjanje jednog indikatora: klik na × pored njegovog imena u legendi gore levo na grafikonu, ili skini kvačicu u listi.
- Uklanjanje svih: dugme Remove all na dnu liste, ili Remove all indicators u meniju desnog klika na grafikonu.
- Neki indikatori postoje dvaput (EMA i EMA 2, SMA i SMA 2) da bi istovremeno prikazao dva perioda, npr. EMA 20 i EMA 50.
- Premium alati (Market Structure, Order Blocks, Liquidity, Divergences, Chart Patterns, Elliott Waves, Order Flow) računaju se na serveru i traže aktivnu pretplatu ili probni period.
Indicator templatesŠabloni indikatora
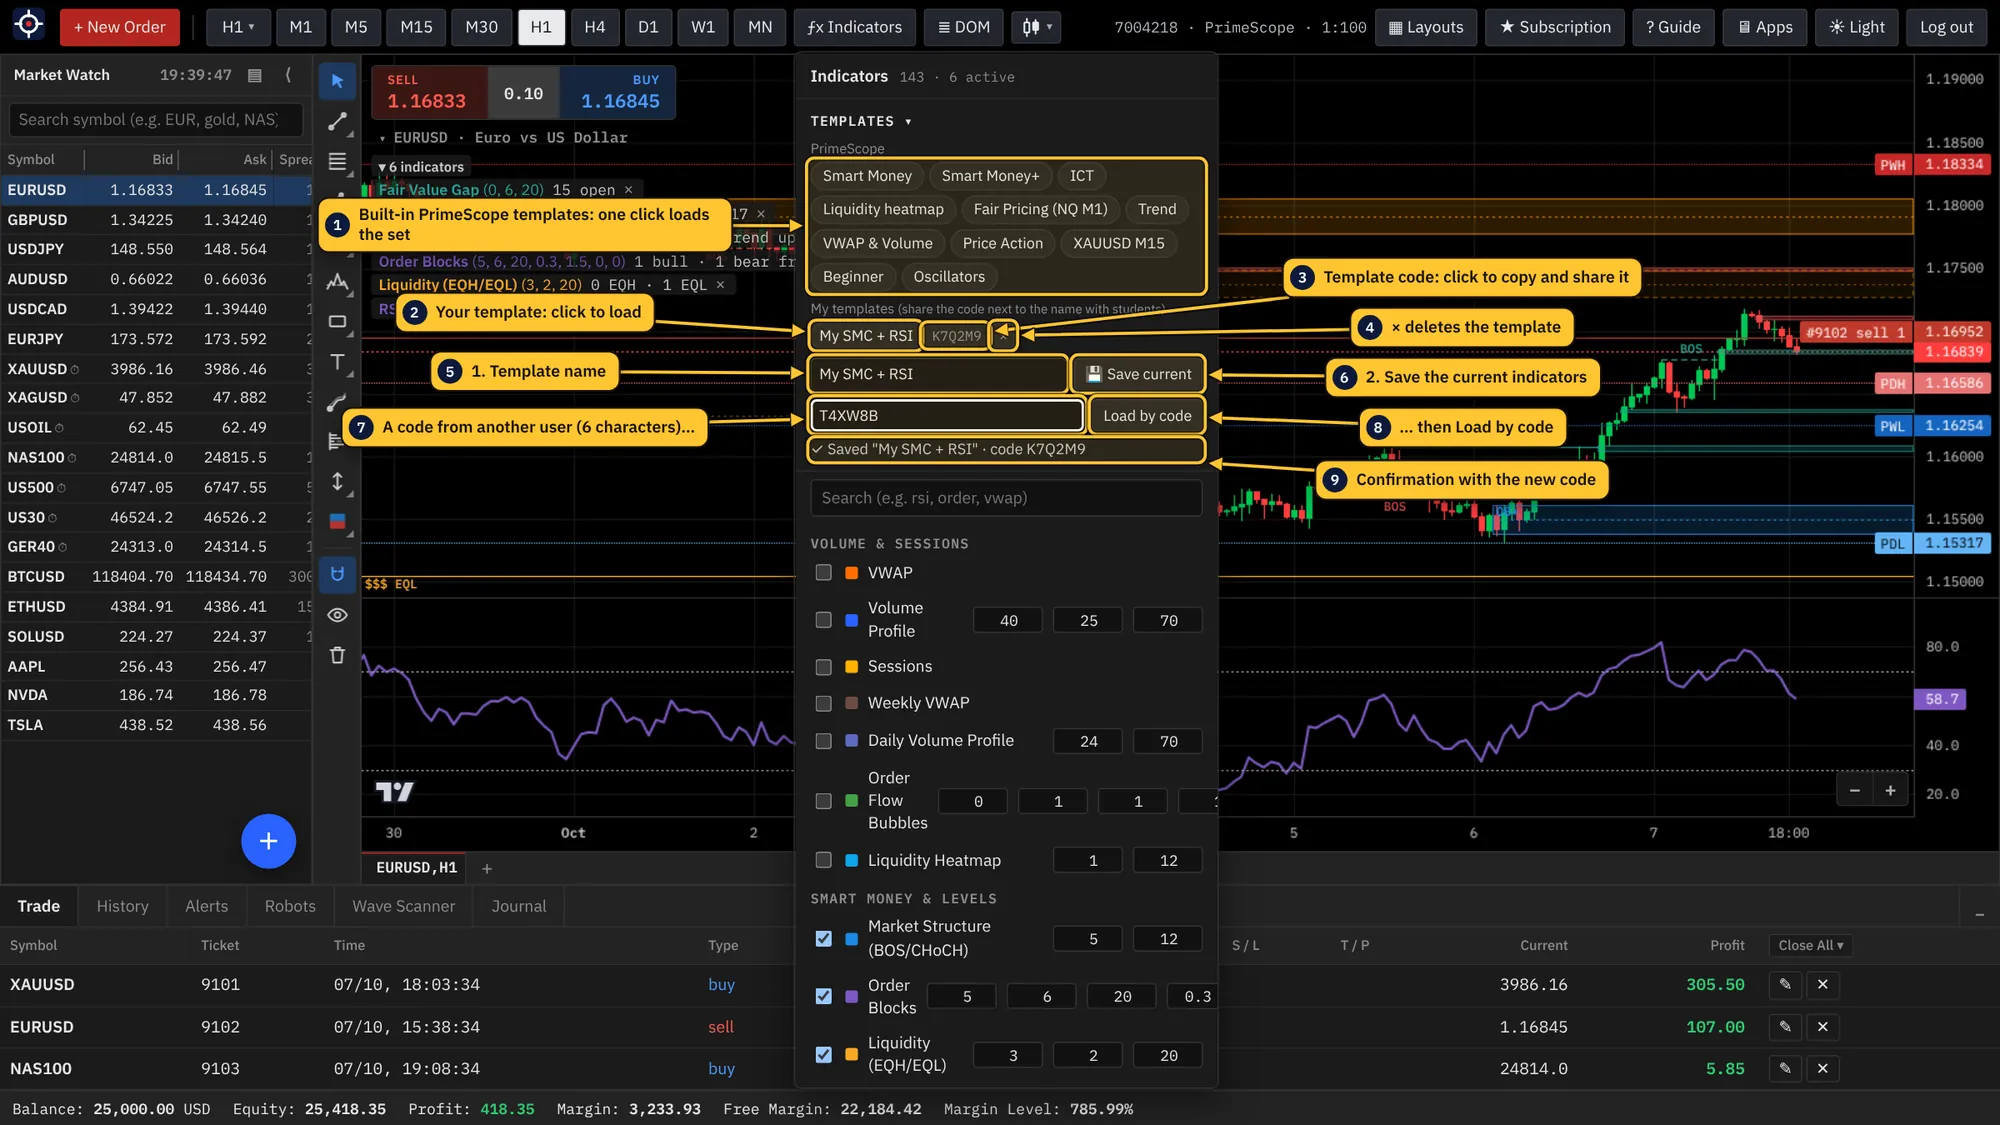
A template is a saved set of indicators with their parameters. Load it on any symbol with one click, or share it with someone through a 6-character code. The templates are at the top of the ƒx Indicators list (click Templates ▸ if the section is collapsed).
Šablon je sačuvan skup indikatora sa parametrima. Učitava se jednim klikom na bilo kom simbolu, a može da se podeli sa drugima preko koda od 6 znakova. Šabloni su na vrhu liste ƒx Indicators (klikni Templates ▸ ako je deo skupljen).
Making your own template
Pravljenje svog šablona
- Turn on the indicators you want and set their parameters (chapter 7). You can also start from a built-in template and add to it.
- Open ƒx Indicators and type a name in the Name field under My templates, for example
My SMC + RSI. - Press 💾 Save current (or Enter). The template appears under My templates with its code next to the name.
- Uključi indikatore koje želiš i podesi parametre (poglavlje 7). Možeš da kreneš i od gotovog šablona pa da dodaš svoje.
- Otvori ƒx Indicators i upiši ime u polje Name ispod My templates, npr.
My SMC + RSI. - Pritisni 💾 Save current (ili Enter). Šablon se pojavljuje pod My templates, sa kodom pored imena.
- Load: click the template name. It replaces the indicators currently on the chart.
- Update: save again under the same name; the template is overwritten.
- Share: click the code next to the name to copy it and send it to a student or a friend. They paste it in Template code and press Load by code.
- Delete: × next to the code.
- Built-in templates (Smart Money, ICT, Trend, VWAP & Volume, Beginner, Oscillators and others) are ready-made sets; hover one to see what it contains.
- Učitavanje: klik na ime šablona. Zamenjuje indikatore koji su trenutno na grafikonu.
- Izmena: sačuvaj ponovo pod istim imenom; šablon se prepisuje.
- Deljenje: klik na kod pored imena ga kopira, pa ga pošalji učeniku ili prijatelju. On ga upiše u Template code i pritisne Load by code.
- Brisanje: × pored koda.
- Gotovi šabloni (Smart Money, ICT, Trend, VWAP & Volume, Beginner, Oscillators i drugi) su pripremljeni setovi; pređi mišem preko imena da vidiš šta sadrže.
LayoutsRasporedi (Layouts)
A layout is a snapshot of the whole workspace: chart tabs, symbols and timeframes, chart type, indicators, drawings (optional), Market Watch, panel sizes and theme. Layouts are stored with your account, so the same layout opens in the browser and in the desktop app.
Raspored je snimak celog radnog prostora: kartice grafikona, simboli i periodi, tip grafikona, indikatori, crteži (po izboru), Market Watch, veličine panela i tema. Rasporedi se čuvaju uz nalog, pa je isti raspored dostupan u browseru i u desktop aplikaciji.
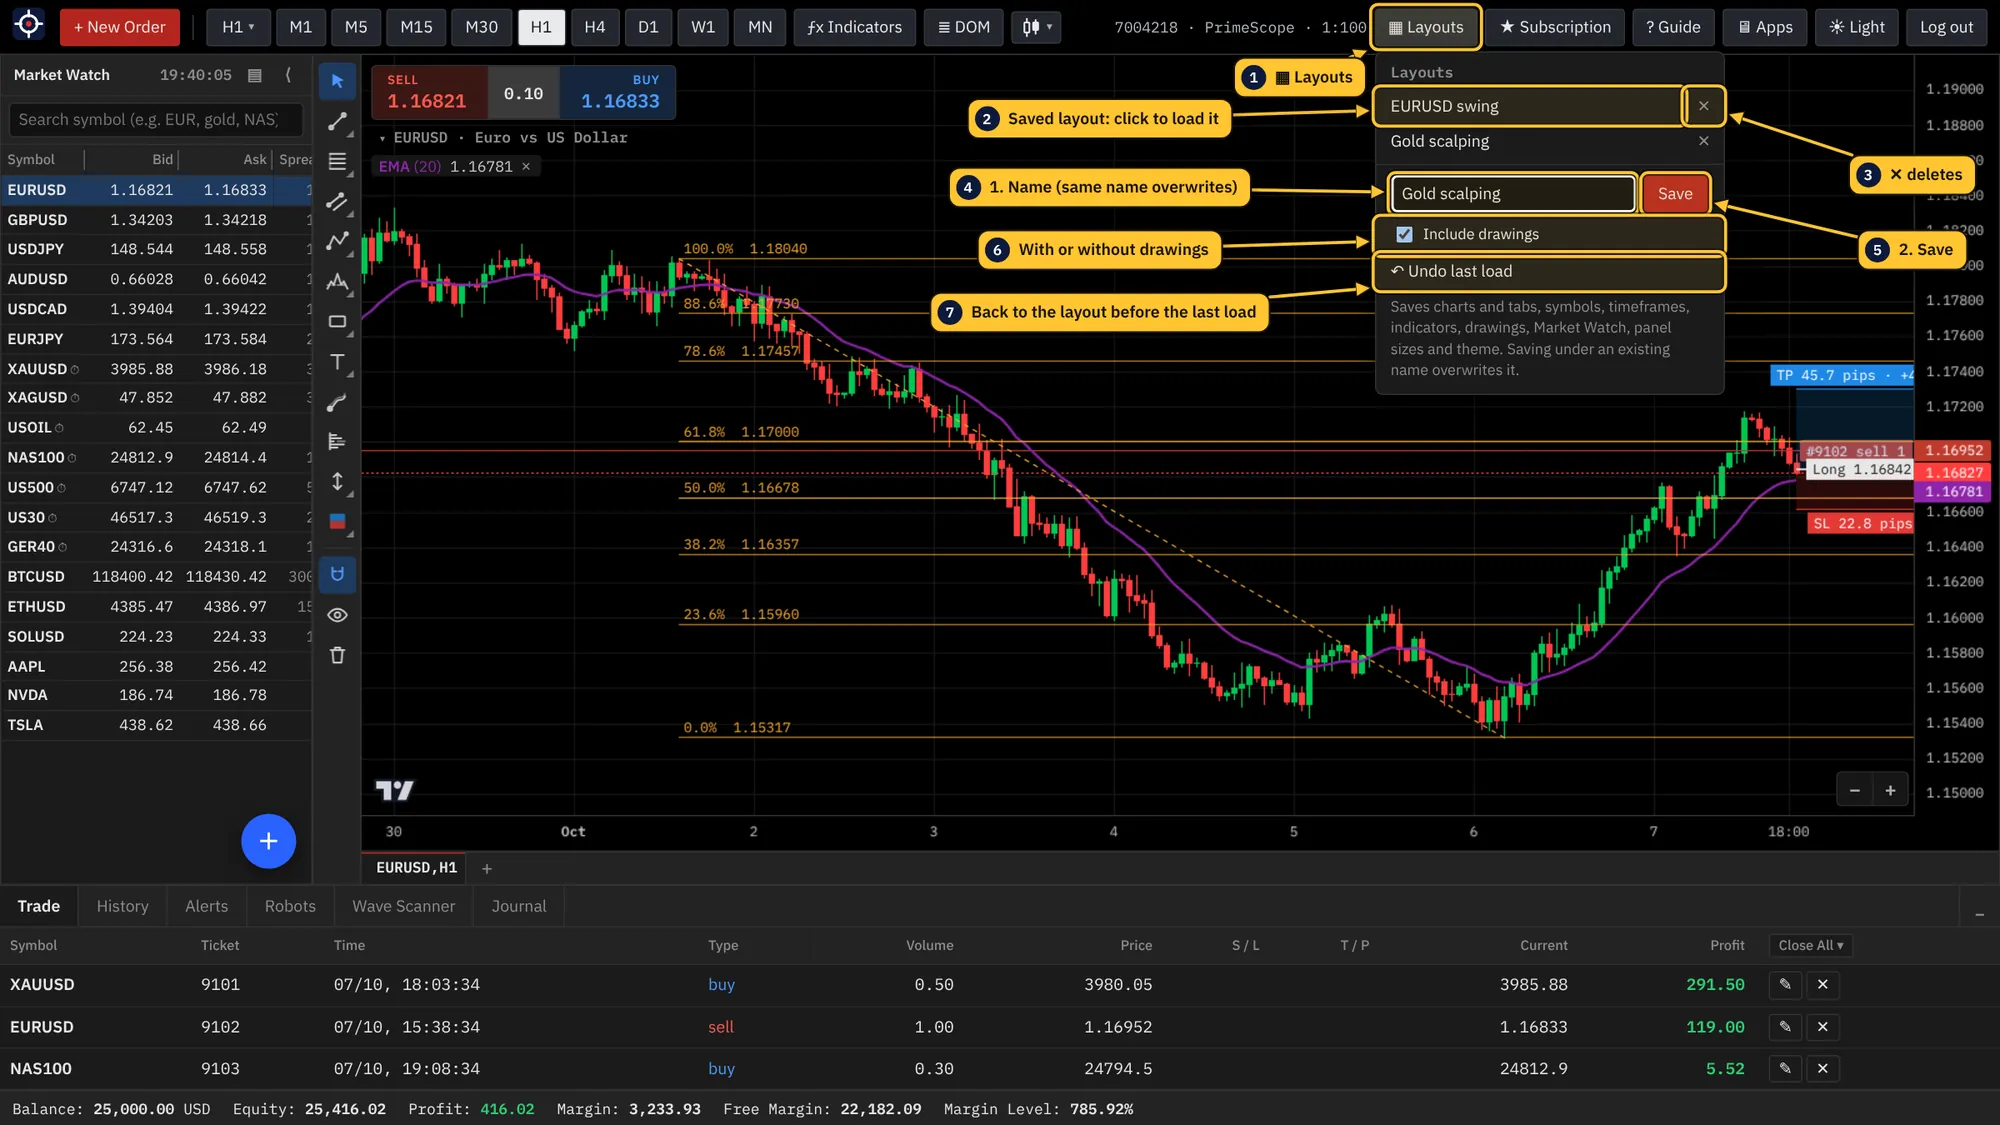
- Arrange the terminal the way you like it.
- Click ▦ Layouts, type a name (for example
Gold scalping) and leave Include drawings ticked if the drawings should be saved too. - Press Save. Saving under an existing name overwrites that layout: the button asks Overwrite? and a second click confirms. Deleting with ✕ works the same way.
- To switch, click a layout name in the same menu, then click it again to confirm. The terminal reloads with that layout.
- Changed your mind? ↶ Undo last load brings back the workspace you had before.
- Namesti terminal kako ti odgovara.
- Klikni ▦ Layouts, upiši ime (npr.
Gold scalping) i ostavi štikliran Include drawings ako i crteži treba da se sačuvaju. - Pritisni Save. Čuvanje pod postojećim imenom prepisuje taj raspored: dugme pita Overwrite?, a drugi klik potvrđuje. Brisanje sa ✕ radi isto.
- Za promenu klikni na ime rasporeda u istom meniju, pa još jednom za potvrdu. Terminal se ponovo učitava sa tim rasporedom.
- Predomislio si se? ↶ Undo last load vraća radni prostor koji si imao pre toga.
| Indicator template | Šablon indikatora | Layout | Raspored | |
|---|---|---|---|---|
| WhereGde | ƒx Indicators → Templates | ▦ Layouts | ||
| SavesČuva | Indicators and their parametersIndikatore i njihove parametre | Charts, symbols, timeframes, indicators, drawings, Market Watch, panels, themeGrafikone, simbole, periode, indikatore, crteže, Market Watch, panele, temu | ||
| LoadingUčitavanje | Instant, on the current chartOdmah, na trenutnom grafikonu | The terminal reloads; Undo is availableTerminal se ponovo učitava; postoji Undo | ||
| SharingDeljenje | Yes, with a 6-character codeDa, kodom od 6 znakova | No, only on your accountNe, samo na tvom nalogu | ||
| Use it forZa šta | A strategy's indicator set (SMC, trend, scalping)Set indikatora jedne strategije (SMC, trend, skalping) | A complete workspace per market or sessionCeo radni prostor po tržištu ili sesiji |
Depth of Market (DOM)Dubina tržišta (DOM)
The DOM shows the live spot order book from Binance for crypto symbols: how much is waiting to be bought (Bid) and sold (Ask) at each price, and how much has traded there. Forex and index CFDs have no central order book, so the window explains that instead.
DOM prikazuje živu spot knjigu naloga sa Binance-a za kripto simbole: koliko čeka za kupovinu (Bid) i prodaju (Ask) na svakoj ceni i koliko je tu izvršeno. Forex i indeksi (CFD) nemaju centralnu knjigu naloga, pa prozor to i napiše.
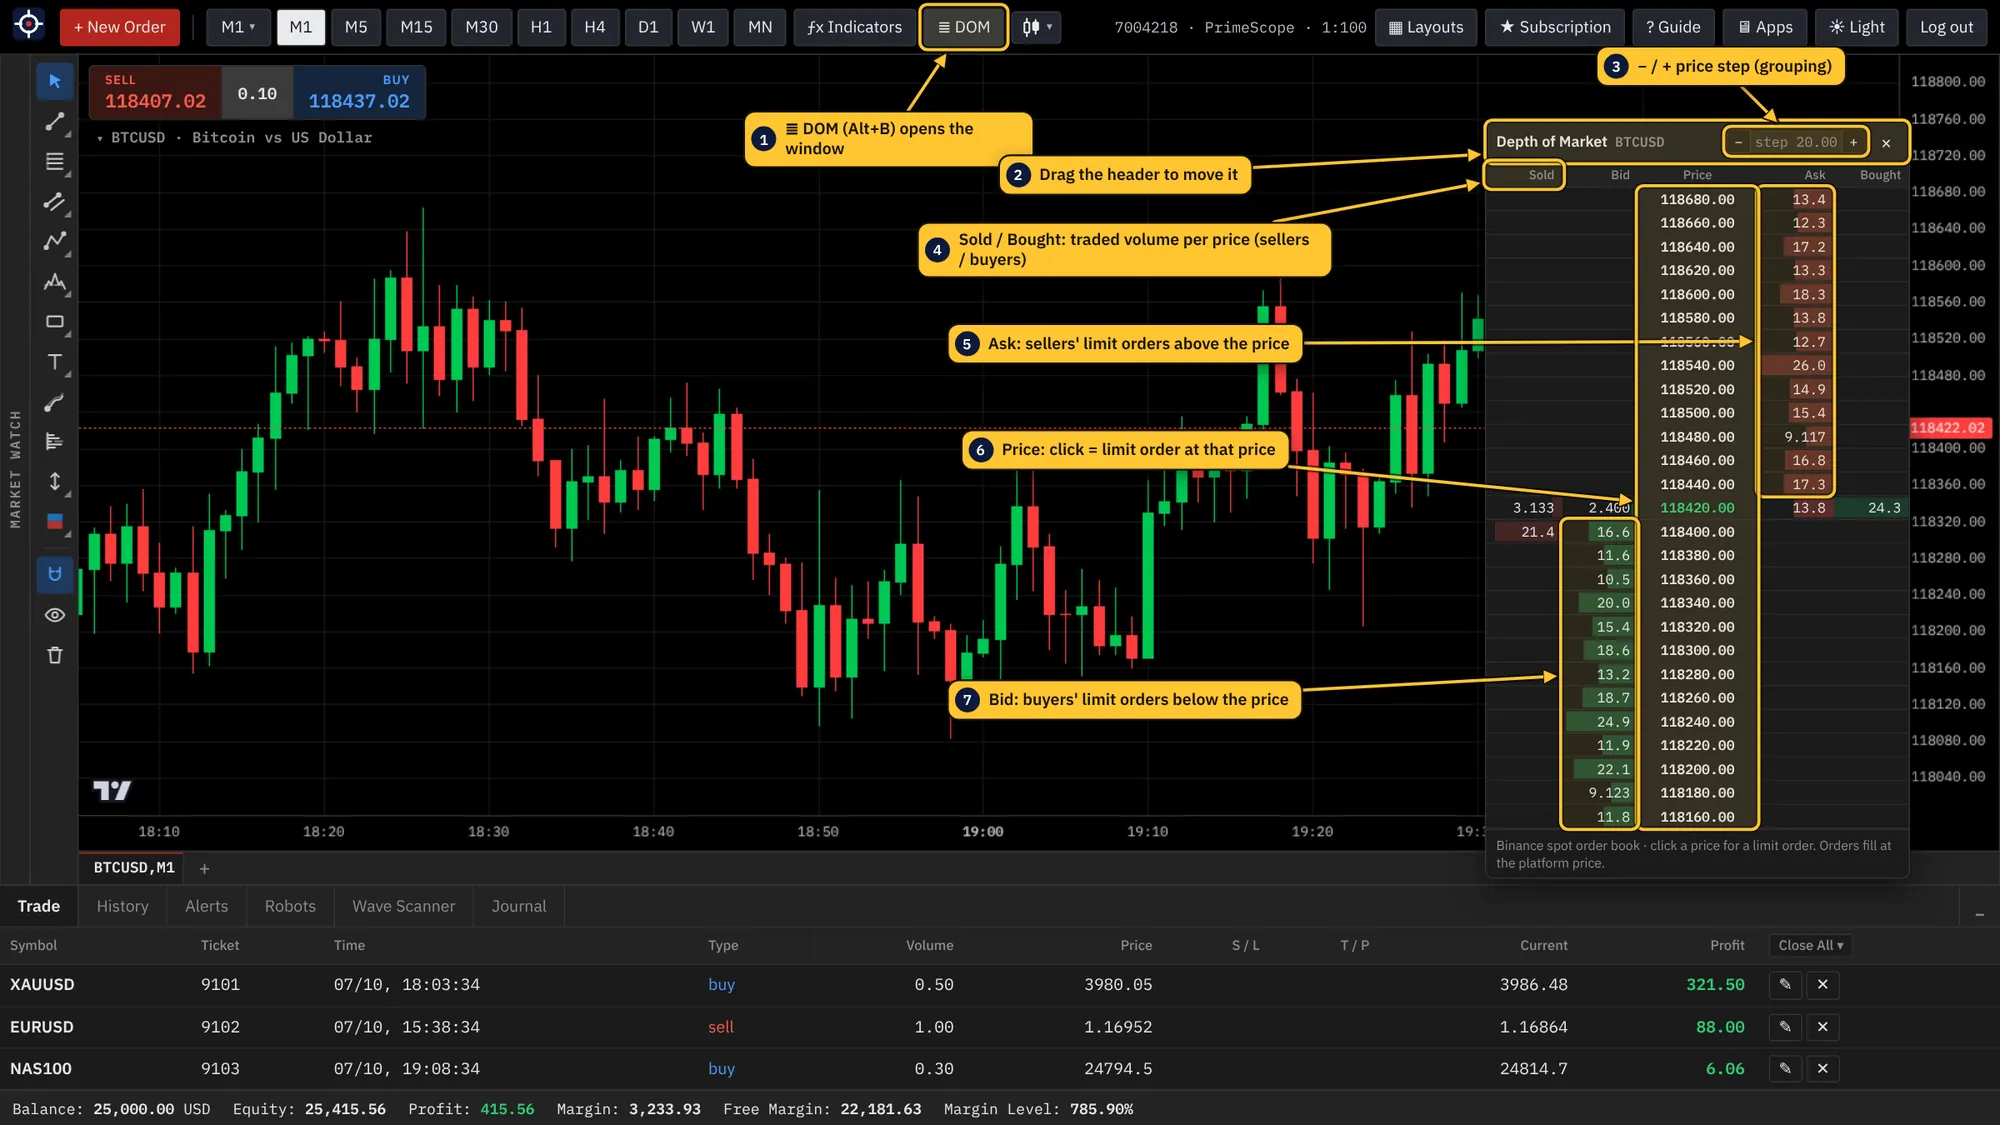
- Open a crypto symbol (for example BTCUSD) and press ≣ DOM or Alt+B.
- Use − / + in the header to group prices in smaller or larger steps.
- Large numbers in Bid or Ask are big resting orders (walls) where price often reacts.
- Click a price to prepare a limit order at it. Orders always fill at the platform price.
- Drag the header to move the window; × closes it.
- Otvori kripto simbol (npr. BTCUSD) i pritisni ≣ DOM ili Alt+B.
- Sa − / + u zaglavlju grupišeš cene u manje ili veće korake.
- Veliki brojevi u Bid ili Ask koloni su veliki nalozi na čekanju (zidovi) na kojima cena često reaguje.
- Klik na cenu priprema limit nalog na toj ceni. Nalozi se uvek izvršavaju po ceni platforme.
- Zaglavlje prevuci da pomeriš prozor; × ga zatvara.
For the same data on the chart, load the built-in Liquidity heatmap template: order book heatmap under the candles, large trades and cumulative volume delta.
Za iste podatke na samom grafikonu učitaj gotov šablon Liquidity heatmap: toplotna mapa knjige naloga ispod sveća, veliki nalozi i kumulativna razlika volumena (CVD).
Keyboard shortcutsPrečice na tastaturi
| Key | Taster | Action | Radnja |
|---|---|---|---|
| F9 | New orderNovi nalog | ||
| + / − | Zoom the chart in / outZumiranje grafikona | ||
| Alt+B | Depth of MarketDubina tržišta | ||
| Ctrl+M | Hide / show Market WatchSakrij / prikaži Market Watch | ||
| Ctrl+F6 | Next chart tab (with Shift: previous)Sledeća kartica grafikona (uz Shift: prethodna) | ||
| Esc | Back to the cursor, close a menu or windowNazad na kursor, zatvara meni ili prozor | ||
| Delete | Delete the selected drawingBriše izabrani crtež | ||
| Ctrl+Z | Undo drawingsVraćanje crteža | ||
| Ctrl (hold)(drži) | Switch the magnet while drawingPrivremeno menja magnet dok crtaš |